Session 6: “For richer, for poorer, in sickness and in health”
Thanks, again, to everyone who made it to the last session of the AGAPE Seminar & Studio and to the many present-absences who shaped the session’s proceedings. I learned a great deal from everyone who participated, and I am very much looking forward to keeping the conversation alive in between sessions until we gather again next session.
Upcoming Session Date: 3 March 2024
Start Time : 10:30 LA / 13:30 NYC / 15:30 São Paulo / 18:30 London / 19:30 Berlin / 21:30 Dar es Salaam / 23:59 Delhi
End Time: 12:30 LA / 15:30 NYC / 17:30 São Paulo / 20:30 London / 21:30 Berlin / 23:30 Dar es Salaam / 02:00 Delhi
Background Readings for the Next Session:
Pages from The Pentagon Of Power: The Myth Of The Machine, Volume II by Lewis Mumford
“The Therapeutic Imagination” from Twin Killers by Muindi Fanuel Muindi
“Late Davosian Holocausts” from The War on Terra by Muindi Fanuel Muindi
“Measure w/ Care” by Muindi Fanuel Muindi
We began our last session by revisiting some maps and statistics that index the wealth inequalities that are the defining feature of Global Apartheid, distinguishing the “Green Zone” where most of the powerful and privileged reside from the “Grey Zone” where most of the dispossessed and denigrated reside (see map below).
According to the most recent Global Wealth Report from Credit Suisse, the richest nation in the Green Zone, the United States, has around 4% of the global population but nearly 40% of all persons on Earth with a million dollars or more in assets, those forming the richest 1% of humanity. What’s more, there are more white Americans belonging to the richest 1% of humanity than to the poorest 50%, around 1 in 7 relative to 1 in 12.
Elsewhere in the Green Zone, the Schengen Area of Western Europe has around 5% of the global population but around 25% of the richest 1% of humanity, and other Green Zone states spanning the Pacific Rim (Canada, Australia, New Zealand, Japan, South Korea, and Taiwan) account for around 15% of the richest 1% despite having only 4% of the global population.
By contrast, in the Grey Zone, we find that China, with ~18% of the global population, has about ~11% of the richest 1%; India, with another ~18%, has only ~1% of the richest 1%; and the continent of Africa, with a further 18% of the global population, does not even have a thousandth of a percent of the richest 1%.

The Global Wealth Pyramid
From the Credit Suisse Global Wealth Report: “The main feature of the two middle pyramid segments is the dominance of China, which accounts for 36% of the total membership, compared to 10% from India, 7% from Latin America and just 4% from Africa. Regional representation is skewed further still among millionaires, where 42% of all members reside in North America, 27% in Europe and 17% in Asia-Pacific (excluding China and India). Thus, in marked contrast to the base of the wealth pyramid (which is characterized by a wide variety of people from all countries and at all stages of life), millionaires are heavily concentrated in particular regions and countries, and tend to share similar lifestyles – participating in the same global markets for luxury goods, vacations and education opportunities for their children, for example, even when they reside in different continents. The wealth portfolios of these individuals are also likely to be more similar, with a focus on financial assets and particularly equities, bonds and other securities traded in international markets.”
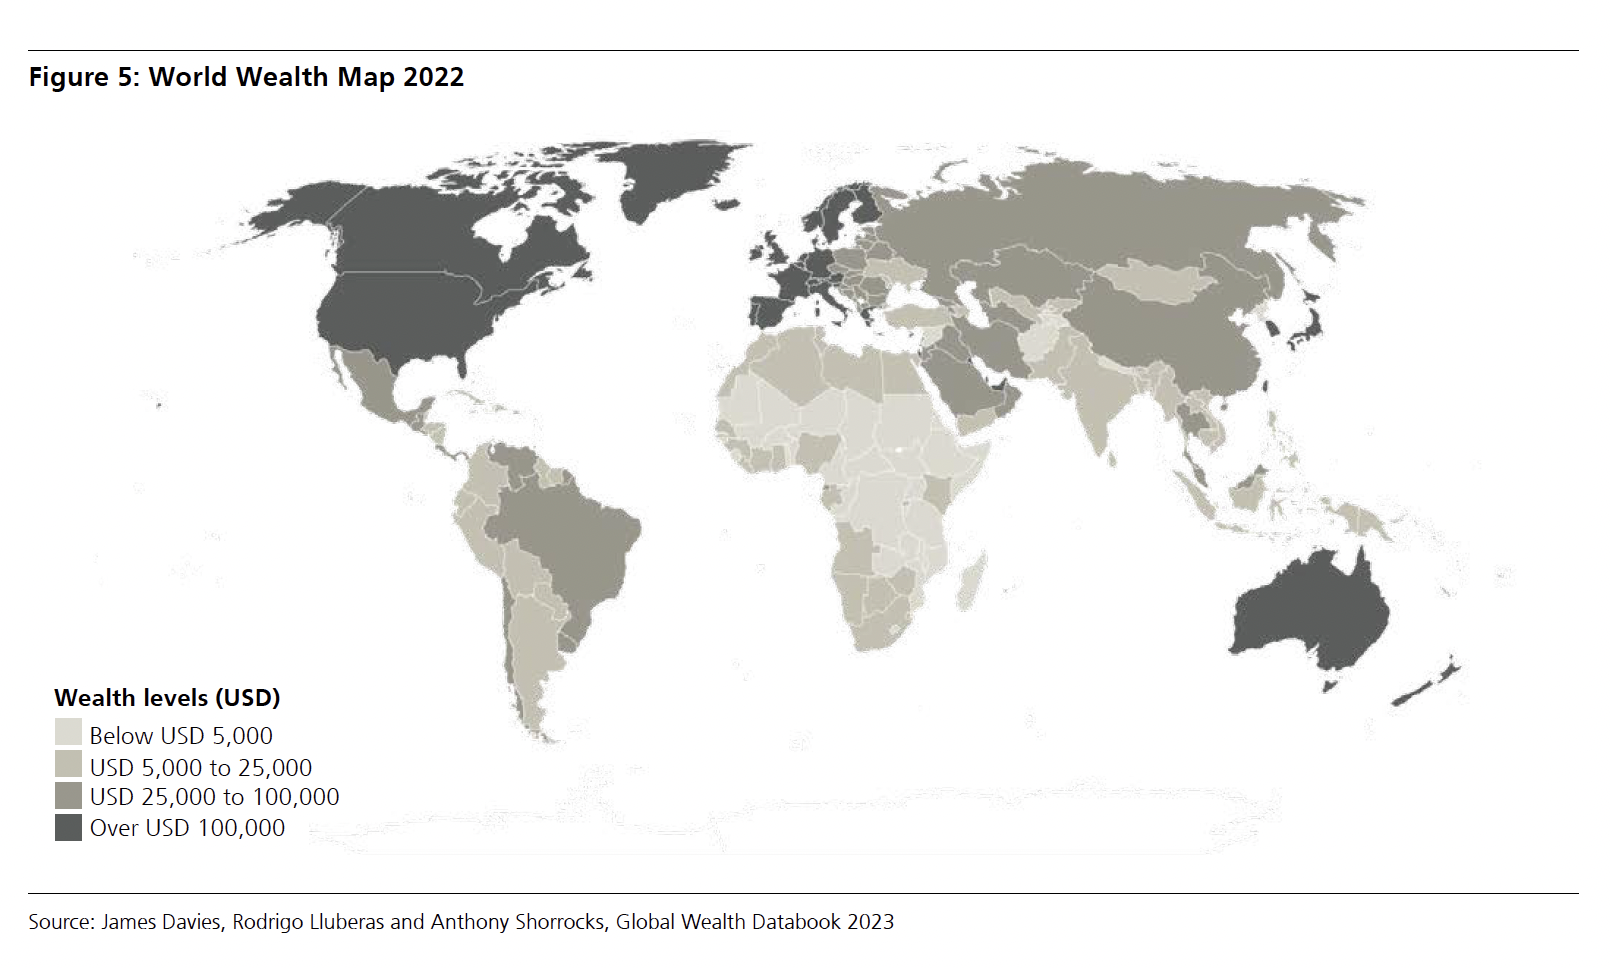
World Wealth Map
From the Credit Suisse Global Wealth Report: “An overall perspective on the disparity of wealth across countries and regions is captured by the World Wealth Map. It shows that nations with high wealth per adult (above USD 100,000) are concentrated in North America and Western Europe, and among the richer parts of East Asia, the Pacific and the Middle East, with a sprinkling of outposts in the Caribbean. China and Russia are core members of the “intermediate wealth” group of countries with mean wealth in the range of USD 25,000–100,000. This group also includes more recent members of the European Union and important emerging-market economies in Latin America, the Middle East and East Asia. One step below, the “frontier wealth” range of USD 5,000–25,000 per adult is a heterogeneous group that covers heavily populated countries such as India, Indonesia and the Philippines, plus much of South America and many of the coastal nations in Africa. Fast-developing Asian countries like Cambodia, Laos and Vietnam also fall within this category. Countries with average wealth below USD 5,000 comprise the final group, which is dominated by countries in central Africa.”
“North America and Europe together account for 56% of total household wealth, but contain only 16% of the world adult population. The wealth share in the Asia- Pacific region (excluding China and India) is quite similar to its share of adults and the same is true for China. But the adult population share is more than double the wealth share in Latin America, five times the wealth share in India and ten times the wealth share in Africa.”
Going further and digging deeper, we tried to get a handle on the material realities that these wealth disparities indexed by examining an article by Jason Hickel, Christian Dorninger, Hanspeter Wieland, and Intan Suwandi titled “Imperialist appropriation in the world economy: Drain from the global South through unequal exchange, 1990–2015”.
The authors of the article conducted a “footprint” analysis of the raw materials, land, energy and labour that are embodied in trade between the Green Zone and Grey Zone — “looking not only at traded goods themselves but also the upstream resources and labour that go into producing and transporting those goods, including the machines, factories, infrastructure, etc.” The results of their analysis were baffling. In a single year, 2015, the Green Zone effectively robbed the Grey Zone of some 12 billion tons of embodied raw materials, 822 million hectares of embodied land, 21 exajoules of embodied energy, and 188 million person-years of embodied labour, totaling $10.8 trillion in Green Zone prices — “enough to end extreme poverty 70 times over.” Looking at a broader span of time, the twenty five year period between 1990-2015, the Green Zone has effectively stolen some $242 trillion (constant 2010 USD) in embodied raw materials, land, energy, and labor from the Grey Zone.

Imperialist appropriation in the world economy: Drain from the global South through unequal exchange, 1990–2015
“[This figure] shows the South’s [i.e., the Grey Zone’s] embodied resource exports and imports to and from the North [i.e., the Green Zone]. It reveals that for every unit of embodied raw material equivalent that the South imports from the North, they have to export on average five units to “pay” for it (a ratio of 5:1). For land the average ratio is also 5:1, for energy it is 3:1, and for labour it is 13:1. This pattern results in significant net flows of resources from South [or the Grey Zone] to North [or the Green Zone].”

“Europe supported by Africa & America”
Colored engraving by William Blake, published in John Gabriel Stedman’s Narrative of a Five Years' Expedition against the Revolted Negroes of Surinam in Guiana on the Wild Coast of South America; from the Year 1772 to 1777
The social and ecological consequences of this brutal regime of extraction, extortion, and exploitation are immense. Excess consumption in the Green Zone, sustained by resources stolen from the Grey Zone, is responsible for soil depletion, water depletion, energy depletion, and massive amounts of pollution in the Grey Zone. Green Zone consumption is effectively starving, poisoning, and disabling the peoples of the Grey Zone and provoking violent conflicts over resources. Hickel, Dorninger, Wieland, and Suwandi summarize their findings as follows:
In sum, our results indicate that high and unsustainable levels of resource consumption in the [Green Zone] rely on patterns of net appropriation from the [Grey Zone]. The benefits accrue to the former while the damage is borne by the latter, generating a significant ecological debt. People in the [Grey Zone]] also disproportionately suffer the social impacts of [Green Zone] growth and consumption, and are deprived of resources necessary for development and provisioning for human needs.
In other words, to put the matter plainly, Green Zone consumption is the driving force behind a Planetary Ecocide whose most abject victims are the peoples of the Grey Zone. Ay, and Global Apartheid serves to keep the peoples of the Grey Zone “in their place”, to keep them from entering the Green Zone where so much stolen wealth is to be enjoyed.
Thinking with and through these baffling statistics, and recognizing that they only speak to 25 years of a 500 year long history of colonial extraction, extortion, and exploitation, we formulated a number of profound thoughts and questions, including the following.
The Green Zone’s ability and willingness to engage in so much theft is symptomatic of a sickness: a deathly addiction to excessive powers and privileges and the titillating and tranquilizing pleasures that attend excessive powers and privileges. This deathly addiction is so all consuming that the Green Zone is willing to destroy the better part of life on earth to satisfy it. While this addiction is perhaps best satisfied in the Green Zone, it is by no means absent from the Grey Zone and accounts for the manner in which Grey Zone elites exploit their peoples. How is this addiction to be diagnosed and treated? What antidotes or therapies are available to us?
We were struck by the fact that, to interpolate Audre Lorde on her birthday, the master’s measures will not dismantle the master’s values. Prevailing measures of “economic development”, “quality of life”, and “standard of living” that have been developed by social scientists and economists in the Green Zone are, in truth, measures of a polity’s capacity to satisfy its addiction to excessive powers and privileges and the titillating and tranquilizing pleasures that attend powers and privileges. What alternative, convivial measures might we use to counter colonial measures and to measure the effectiveness of antidotes and therapies that would treat the deathly addiction described above?
In keeping with the above, we were equally struck by the fact that the master’s maps will not dismantle the master’s worldview. As we examined mappings of the colonial and convivial, we speculated upon new cartographic tools and techniques that we might deploy in order to counter colonial worldviews with convivial worldviews. We considered mapping the diffusion of musics and poetics across the world or, even more profoundly, treating different musics and poetics themselves as alternative mappings of worlds.
We recognized that those fleeing the Grey Zone for the Green Zone are not seeking to access wealth that properly belongs to the Green Zone but, rather, they are seeking to access wealth that the Green Zone has stolen from the Grey Zone. It follows from this that countering Global Apartheid and Planetary Ecocide means two things. On the one hand, it means (re-)constructing and maintaining convivial infrastructures that would enable the migration of peoples from the Grey Zone to the Green Zone in defiance of colonial bordering regimes. On the other hand, it means sabotaging and abolishing the colonial infrastructures that are employed by the Green Zone to extract, extort, and exploit land, labor, matter, energy from the Grey Zone. How might we enable and engage in ethical practices of smuggling and sabotage against Global Apartheid and Planetary Ecocide? In addition to the conductors of the Underground Railroad, whom might we regard as role models in this regard? Thinking through the origins and deployment of the trope of an “Underground Railroad”, are there other infrastructures, aside from that of the Railroad, that might better suited to serve as metaphors for us in our dual roles as smugglers and saboteurs?
We will return to all of the above and more during our next session…